

Grafana, InfluxDB, and Telegraf are popular open-source tools used for time-series data analysis and visualization.
Grafana: Grafana is a popular platform for creating and visualizing time-series data. It provides a web interface for creating and customizing dashboard panels that display time-series data in real-time. Grafana supports multiple data sources, including InfluxDB, and provides a wide range of visualization options, including line charts, bar charts, heat maps, and more.
InfluxDB: InfluxDB is a high-performance time-series database that is optimized for storing and querying time-stamped data. It supports data storage for metrics and events, and provides a SQL-like query language for accessing data. InfluxDB is highly scalable and can handle large amounts of data, making it suitable for use in monitoring and analytics applications.
Telegraf: Telegraf is an agent for collecting and reporting metrics. It can gather data from a wide range of sources, including system metrics, network devices, and cloud services, and send the data to a variety of outputs, including InfluxDB. Telegraf provides a rich set of plugins for collecting data, making it easy to integrate with a wide range of systems and services.
Together, these tools form a powerful stack for time-series data analysis and visualization. Grafana provides a visual interface for analyzing and exploring data, while InfluxDB provides a high-performance database for storing and querying time-series data. Telegraf collects and reports metrics, providing a bridge between data sources and the InfluxDB database.
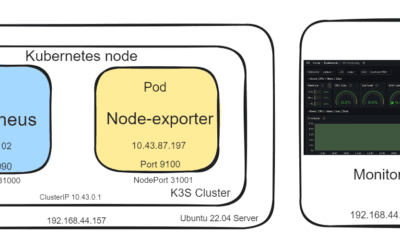
Because the number of devices in our digitalized world is continually expanding, real-time monitoring and management of those devices is becoming increasingly important. To collect real time data, we need an agent or data collector in server that will collect data stream using TCP, UDP, gRPC etc. In this post, we’ll utilize telegraf to gather bandwidth data from a Cisco IOS XE (Cisco A901-12C-FT-D Version 15.6(2r)SP4 ) router, store them in InfluxDB, and then view in Grafana after some calculations in the mbps format.
All of the tools’ installation instructions are available online.
Step 1: Install telegraf in Ubuntu 16.04 server:
|
1 2 3 4 5 |
wget https://dl.influxdata.com/telegraf/releases/telegraf_1.19.0-1_amd64.deb sudo dpkg -i telegraf_1.19.0-1_amd64.deb systemctl status telegraf sudo service telegraf status sudo systemctl restart telegraf |
The configuration file is located in this directory: /etc/telegraf
Step 2: Install InfluxDB:
|
1 2 3 4 5 6 7 |
wget -qO- https://repos.influxdata.com/influxdb... | sudo apt-key add - source /etc/lsb-release echo "deb https://repos.influxdata.com/debian $(lsb_release -cs) stable" | sudo tee /etc/apt/sources.list.d/influxdb.list sudo apt-get update && sudo apt-get install influxdb sudo systemctl unmask influxdb.service sudo systemctl start influxdb influxd -config /etc/influxdb/influxdb.conf |
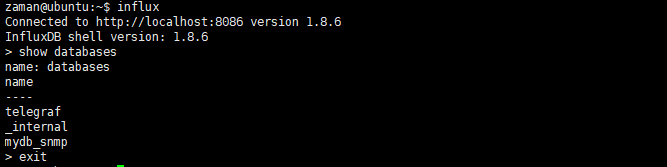
Create database in influxdb: In CMD type
- influx
- create database:>create database mydb_snmp
> show databases
- Use new created database:
>use mydb_snmp
>exit
For the time being, we haven’t set up any usernames or passwords. Blank (“”) is the default credential.
Install Grafana:
|
1 2 3 4 5 6 7 8 |
wget -q -O - https://packages.grafana.com/gpg.key | sudo apt-key add - sudo add-apt-repository "deb https://packages.grafana.com/enterpri... stable main" sudo apt update sudo apt install grafana sudo systemctl start grafana-server sudo systemctl status grafana-server sudo systemctl enable grafana-server sudo systemctl restart grafana-server |
LOG directory: /var/log/grafana
Plugin directory: /var/lib/grafana/plugins
Fix some directory permission related issue by allowing Grafana user:
|
1 2 |
chown -R grafana:grafana /var/lib/grafana/plugins chmod -R 700 /var/lib/grafana/plugins |
Plugin link: https://grafana.com/blog/2020/08/26/popular-community-plugins-that-can-improve-your-grafana-dashboards/
Let’s install a plugin in cli: Clock plugin
sudo grafana-cli plugins install grafana-clock-panel
Start Grafana server and enable it to start on boot time with the following command:
|
1 2 3 |
sudo systemctl daemon-reload sudo systemctl enable grafana-server sudo systemctl start grafana-server |
Next, check the status of Grafana server using the following command:
sudo systemctl status grafana-server
Let’s allow a port in the firewall:
sudo ufw allow 3000/tcp
Graphana dashboard: http://your_server_ip:3000/login
Documentation on how to set up Grafana to connect to influxdb: https://docs.influxdata.com/influxdb/v1.8/tools/grafana/
Adding user: https://grafana.com/tutorials/create-users-and-teams/?utm_source=grafana_gettingstarted

Finally, we must connect grafana to our InfluxDB database.
Lets begin from our router configuration
Configure router SNMP Community String for server.
|
1 2 3 4 |
snmp-server community your_comminity_string RO snmp-server queue-length 1000 snmp-server location router_name snmp ifmib ifindex persist |
We’re declaring a read-only community string here, which we’ll utilize in the telegraf agent so that telegraf can communicate with the device.
Snmp host can be configured in the router as an option. When certain events occur in the router, trap notifications can be sent to the server telegraf agent.
|
1 2 3 4 |
snmp-server trap-source Loopback1 snmp-server enable traps snmp authentication linkdown linkup snmp-server enable traps transceiver all snmp-server host x.x.x.x version 2c your_ SNMPv1/v2c_community_string l2tun-session l2tun-pseudowire-status bgp alarms bfd aaa_server cpu cef snmp |
Our server ip must be reachable from the router loopback ip in this case.
Configure telegraf:
Inside conf file:
|
1 2 3 4 5 6 7 8 9 10 11 12 13 14 15 16 17 18 19 20 21 22 23 24 25 26 27 28 29 30 31 32 33 34 35 36 37 38 39 40 41 42 43 44 45 46 47 48 49 50 51 52 53 54 |
[global_tags] [agent] interval = "250ms" round_interval = false metric_batch_size = 10000 metric_buffer_limit = 50000 collection_jitter = "0s" flush_interval = "10s" flush_jitter = "0s" precision = "1ms" hostname = "" omit_hostname = false [[outputs.influxdb]] database = "mydb_snmp" urls = [ "http://127.0.0.1:8086" ] username = "" password = "" [[outputs.influxdb]] [[inputs.snmp]] agents = ["x.x.x.x:161"] version = 2 community = "your_community_string" name = "snmp" [[inputs.snmp.field]] name = "hostname" oid = "RFC1213-MIB::sysName.0" is_tag = true [[inputs.snmp.field]] name = "uptime" oid = "DISMAN-EXPRESSION-MIB::sysUpTimeInstance" [[inputs.snmp.table]] name = "interface" inherit_tags = [ "hostname" ] oid = "IF-MIB::ifTable" [[inputs.snmp.table.field]] name = "ifDescr" oid = "IF-MIB::ifDescr" is_tag = true [[inputs.snmp.table]] name = "interface" inherit_tags = [ "hostname" ] oid = "IF-MIB::ifXTable" [[inputs.snmp.table.field]] name = "ifDescr" oid = "IF-MIB::ifDescr" is_tag = true [[inputs.snmp.table]] name = "interface" inherit_tags = [ "hostname" ] oid = "EtherLike-MIB::dot3StatsTable" [[inputs.snmp.table.field]] name = "ifDescr" oid = "IF-MIB::ifDescr" is_tag = true |
First, we’ll create an agent that will gather data from the router every 250 milliseconds. Then, with the database name mydb_snmp, we define our output database InfluxDB. Following that, we define our router agent that will provide matrix or time series data. SNMP trap setups are not being configured right now. When we configure traps, the device can deliver trap notifications to telegraf.
This is the influx query that will produce bandwidth graf of port Gi 0/2.

|
1 |
SELECT non_negative_difference(distinct("ifHCOutOctets")) *8 /( 1024*1024*30) FROM "interface" WHERE ("agent_host" = 'x.x.x.x' AND "ifDescr" = 'GigabitEthernet0/2') AND $timeFilter GROUP BY time(30s) fill(null) |

Bandwidth from router


Visualizing data with Grafana has great benefit for several reasons:
Understanding patterns and trends: Grafana provides a visual representation of time-series data, making it easier to identify patterns and trends that might not be immediately apparent from raw data. This can help to uncover insights and inform decision-making.
Improved Communication: Graphical representations of data are often more effective than raw data when it comes to communicating insights and results to stakeholders. Grafana dashboards provide a clear, easy-to-understand visual representation of data that can be shared with others to facilitate communication and collaboration.
Real-time monitoring: Grafana provides real-time data visualization, allowing you to monitor systems and services in real-time. This is particularly useful for identifying and addressing issues before they escalate into larger problems.
Customization and customization: Grafana provides a wide range of customization options, including the ability to create custom dashboard panels, choose from a variety of visualization types, and create alerts based on certain conditions. This allows you to create dashboards that are tailored to your specific needs and use cases.
Integration with other tools: Grafana integrates with a wide range of data sources, including InfluxDB, and supports a variety of plugins for integrating with other tools and services. This makes it possible to create a unified view of data from multiple sources and systems, improving the overall accuracy and comprehensiveness of your data analysis.
Overall, visualizing data with Grafana can help to improve the accuracy and effectiveness of data analysis, support real-time monitoring and decision-making, and enhance communication and collaboration.


0 Comments