

Do you want to get Kubernetes flavor for Prometheus monitoring? Want to see live metrics on Grafana? In this article, we’ll guide you through:
- Deploying Prometheus and Node Exporter on K3S.
- Monitor Linux host metrics on Grafana dashboard exported by Prometheus node exporter.
Steps:
- Set up K3S for your Kubernetes environment.
- Deploy Prometheus on Kubernetes cluster using K3S.
- Define a Kubernetes manifest file describing the Prometheus deployment and then apply it to the cluster.
- Deploy Node Exporter on Kubernetes cluster.
- Expose ports via nodeport to enable external access to Prometheus and Node Exporter from outside the Kubernetes cluster.
- Install Grafana to visualize and analyze your monitoring data.
- Import Node Exporter Full Grafana template.
- Add Prometheus as a data source in Grafana.
Source code: Github link
K3S Installation ubuntu server 22.04: Execute the following command to install K3S:
|
1 |
curl -sfL https://get.k3s.io | sh – |
It fetches a script from https://get.k3s.io using curl, then executes the script to set up a K3S Kubernetes cluster with one node, using sh -.
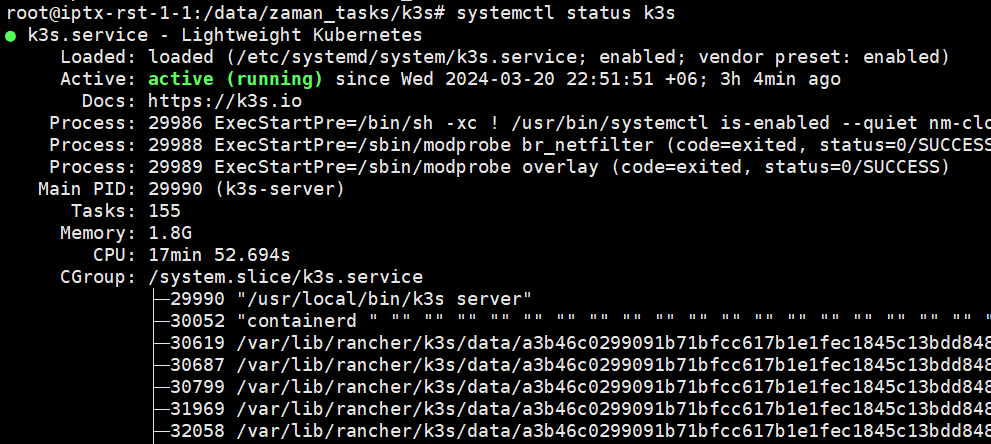
After installation we can check the status:
|
1 |
systemctl status k3s |
To view all resources in the kube-system namespace:
|
1 |
sudo kubectl get all -n kube-system |
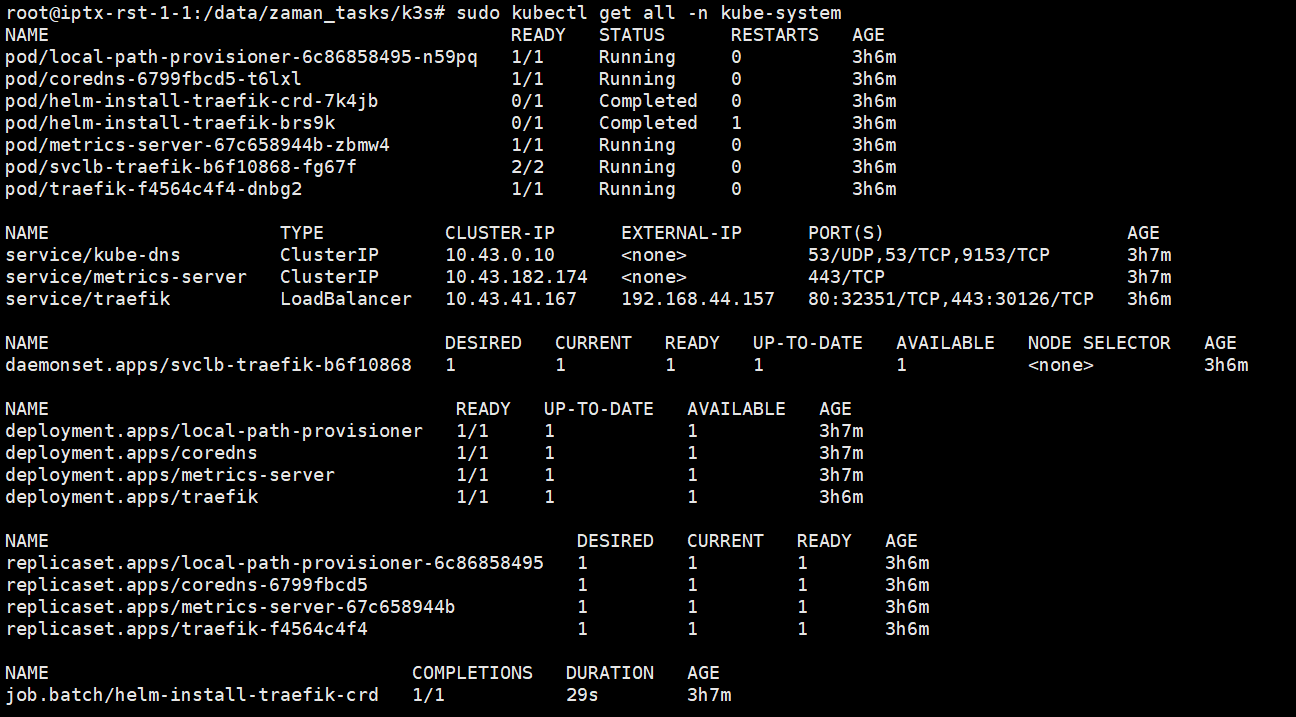
This output shows resources running in the kube-system namespace, including pods, services, daemonsets, deployments, replica sets, and jobs.
Deploy Prometheus on Kubernetes cluster using k3s
1. Service Definition (prometheus-service.yaml)
This YAML file defines a Kubernetes Service named “prometheus”. It specifies the selector to target pods labeled with “app: prometheus” and exposes port 9090.
|
1 2 3 4 5 6 7 8 9 10 11 |
apiVersion: v1 kind: Service metadata: name: prometheus spec: selector: app: prometheus ports: - protocol: TCP port: 9090 targetPort: 9090 |
2. Deployment Definition (prometheus-deployment.yaml)
This YAML file defines a Kubernetes Deployment for Prometheus. It ensures that one instance of the Prometheus container is running. It specifies the Prometheus Docker image, exposes port 9090, and mounts a configuration volume.
|
1 2 3 4 5 6 7 8 9 10 11 12 13 14 15 16 17 18 19 20 21 22 23 24 25 26 27 28 |
apiVersion: apps/v1 kind: Deployment metadata: name: prometheus spec: replicas: 1 selector: matchLabels: app: prometheus template: metadata: labels: app: prometheus spec: containers: - name: prometheus image: prom/prometheus ports: - containerPort: 9090 args: - "--config.file=/etc/prometheus/prometheus.yml" volumeMounts: - name: config mountPath: /etc/prometheus volumes: - name: config configMap: name: prometheus-config |
3. Exposing Prometheus with NodePort (prometheus-nodeport.yaml)
This YAML file configures a NodePort Service for Prometheus, allowing access from outside the Kubernetes cluster on port 31000.
|
1 2 3 4 5 6 7 8 9 10 11 12 13 14 15 |
apiVersion: v1 kind: Service metadata: name: prometheus labels: app: prometheus spec: type: NodePort selector: app: prometheus ports: - name: prometheus-port port: 9090 targetPort: 9090 nodePort: 31000 # Choose a port number within the range of NodePort ports |
Now apply them.
kubectl apply -f prometheus-service.yaml
kubectl apply -f prometheus-deployment.yaml
kubectl apply -f prometheus-nodeport.yaml
4. Creating a ConfigMap (prometheus-configmap.yaml)
This YAML file defines a Kubernetes ConfigMap named “prometheus-config”, containing the Prometheus configuration stored in a file named “prometheus.yml”. The configuration includes a global scrape interval of 15 seconds and a scrape configuration for scraping metrics from a Node Exporter running on port 9100.
|
1 2 3 4 5 6 7 8 9 10 11 12 |
apiVersion: v1 kind: ConfigMap metadata: name: prometheus-config data: prometheus.yml: |- global: scrape_interval: 15s scrape_configs: - job_name: node static_configs: - targets: ['node-exporter:9100'] |
kubectl apply -f prometheus-configmap.yaml
By creating and applying this ConfigMap, we ensure that Prometheus is configured to scrape metrics from the Node Exporter service
Deploy Node Exporter on Kubernetes cluster:
1. Service Definition (node-exporter-service.yaml)
This YAML file defines a Kubernetes Service named “node-exporter” to expose the Node Exporter on port 9100. It selects pods labeled with “app: node-exporter”.
|
1 2 3 4 5 6 7 8 9 10 11 |
apiVersion: v1 kind: Service metadata: name: node-exporter spec: selector: app: node-exporter ports: - protocol: TCP port: 9100 targetPort: 9100 |
2. Deployment Definition (node-exporter-deployment.yaml)
This YAML file defines a Kubernetes Deployment for the Node Exporter. It ensures that one instance of the Node Exporter container is running, using the prom/node-exporter:v1.2.2 Docker image, and exposes port 9100.
|
1 2 3 4 5 6 7 8 9 10 11 12 13 14 15 16 17 18 19 |
apiVersion: apps/v1 kind: Deployment metadata: name: node-exporter spec: replicas: 1 selector: matchLabels: app: node-exporter template: metadata: labels: app: node-exporter spec: containers: - name: node-exporter image: prom/node-exporter:v1.2.2 ports: - containerPort: 9100 |
3. Exposing Node Exporter with NodePort (node-exporter-nodeport.yaml)
This YAML file configures a NodePort Service for the Node Exporter, allowing access from outside the Kubernetes cluster on port 31001.
|
1 2 3 4 5 6 7 8 9 10 11 12 13 14 15 |
apiVersion: v1 kind: Service metadata: name: node-exporter labels: app: node-exporter spec: type: NodePort selector: app: node-exporter ports: - name: node-exporter-port port: 9100 targetPort: 9100 nodePort: 31001 |
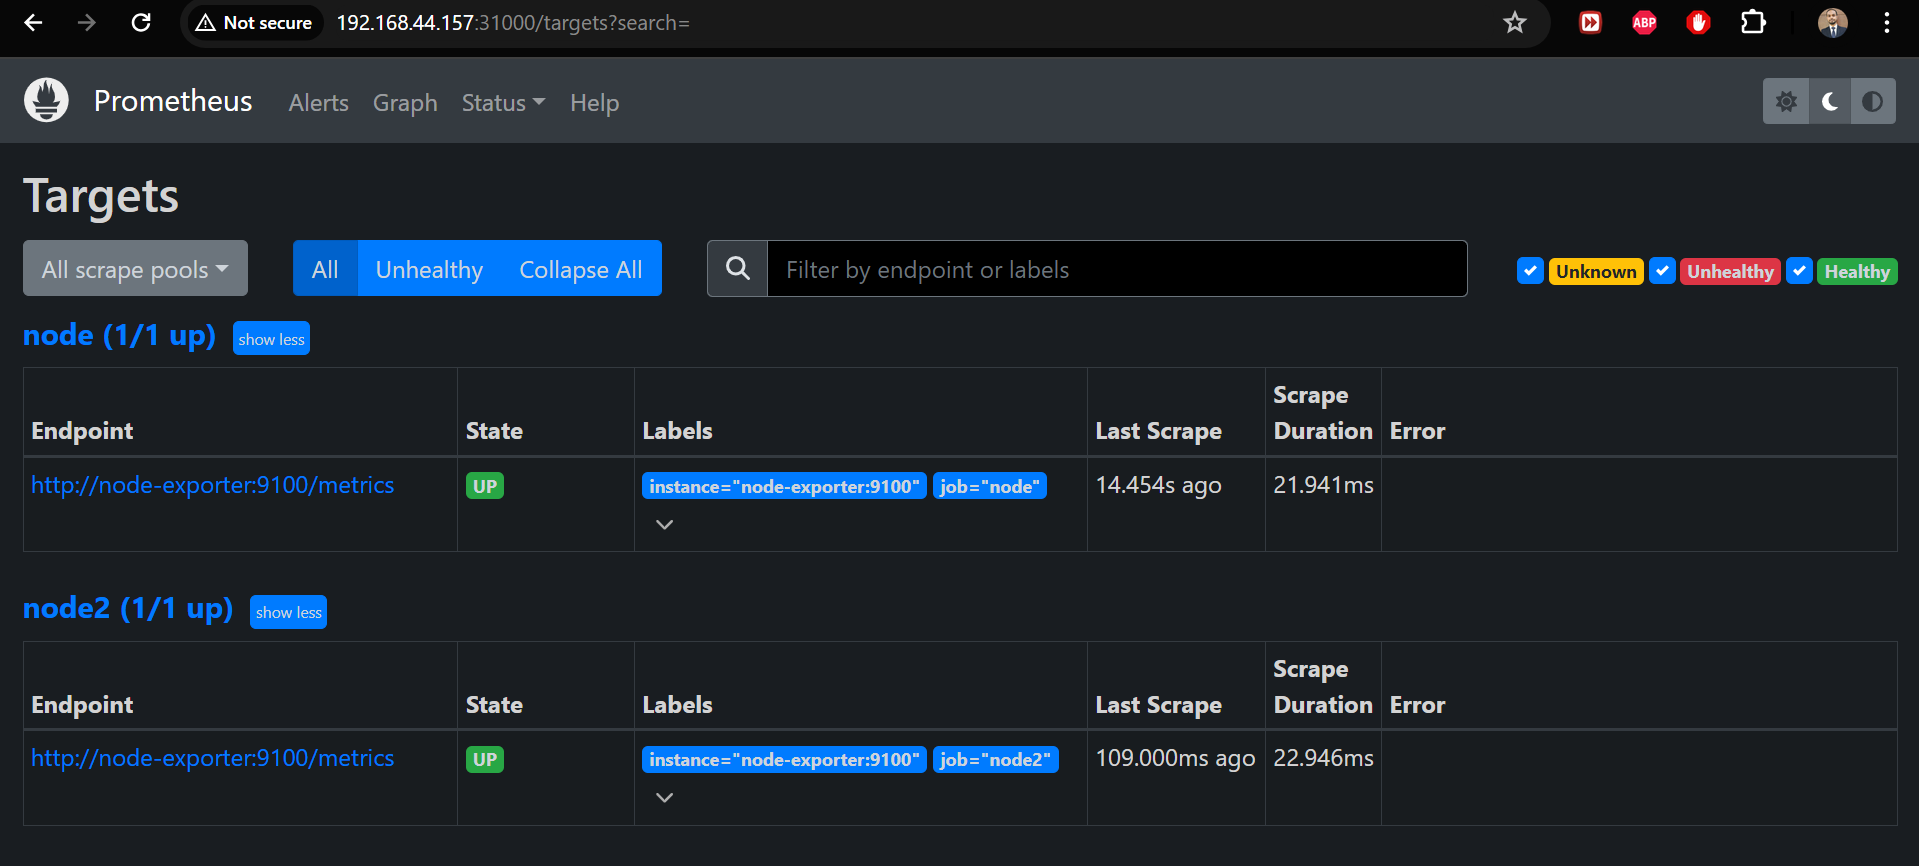
Access Prometheus from outside:
Access node-exporter from outside:

Install Grafana
https://grafana.com/docs/grafana/latest/setup-grafana/installation/debian/
Install the prerequisite packages:
|
1 |
sudo apt-get install -y apt-transport-https software-properties-common wget |
Import the GPG key:
|
1 2 |
sudo mkdir -p /etc/apt/keyrings/ wget -q -O - https://apt.grafana.com/gpg.key | gpg --dearmor | sudo tee /etc/apt/keyrings/grafana.gpg > /dev/null |
To add a repository for stable releases, run the following command:
|
1 |
echo "deb [signed-by=/etc/apt/keyrings/grafana.gpg] https://apt.grafana.com stable main" | sudo tee -a /etc/apt/sources.list.d/grafana.list |
Run the following command to update the list of available packages:
|
1 |
sudo apt-get update |
To install Grafana OSS,
|
1 |
sudo apt-get install grafana |
Start the Grafana server:
|
1 2 |
sudo systemctl start grafana-server sudo systemctl status grafana-server |
Configure the Grafana server to start at boot using system:
|
1 |
sudo systemctl enable grafana-server.service |

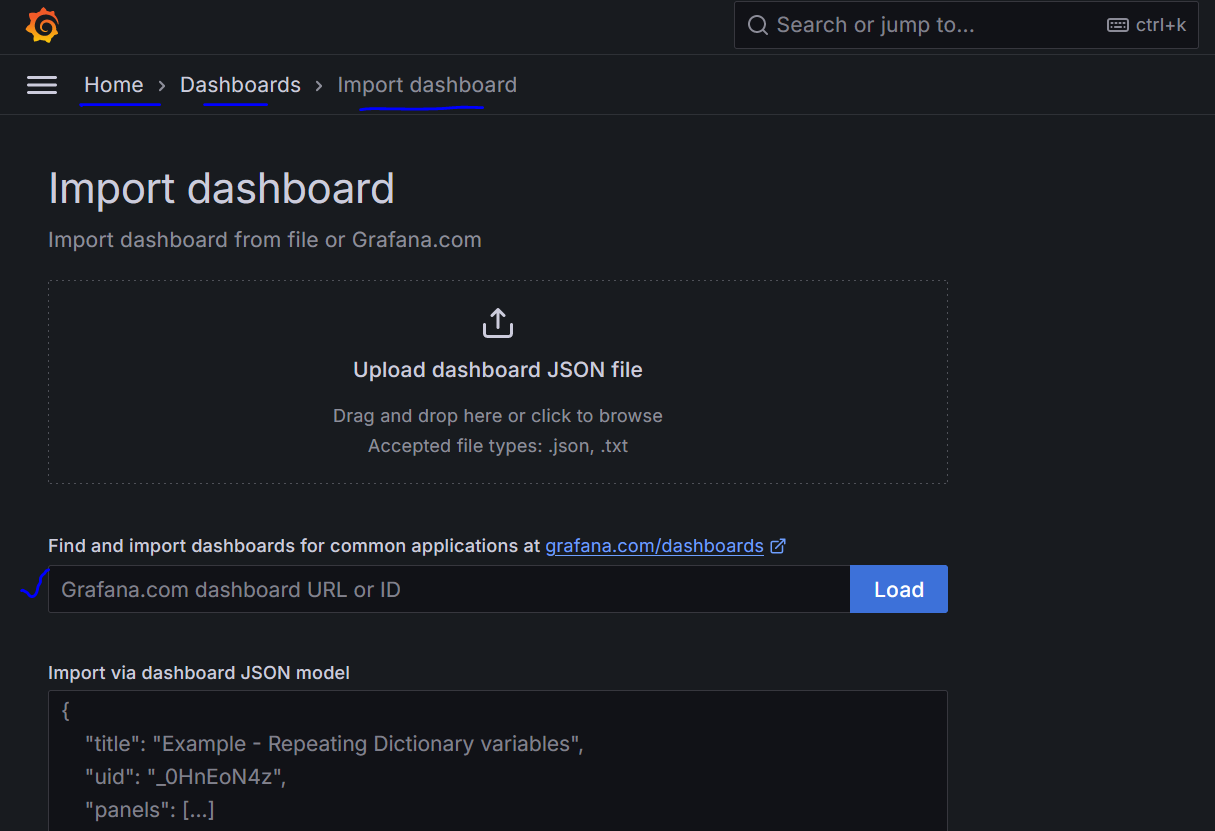
Import Node Exporter Full Grafana template
URL: https://grafana.com/grafana/dashboards/1860-node-exporter-full/
Copy ID from right side of the page and provide mentioned field and click load.
Add Prometheus data source

Provide a name and url: http://server_ip:31000/

Click save and test.
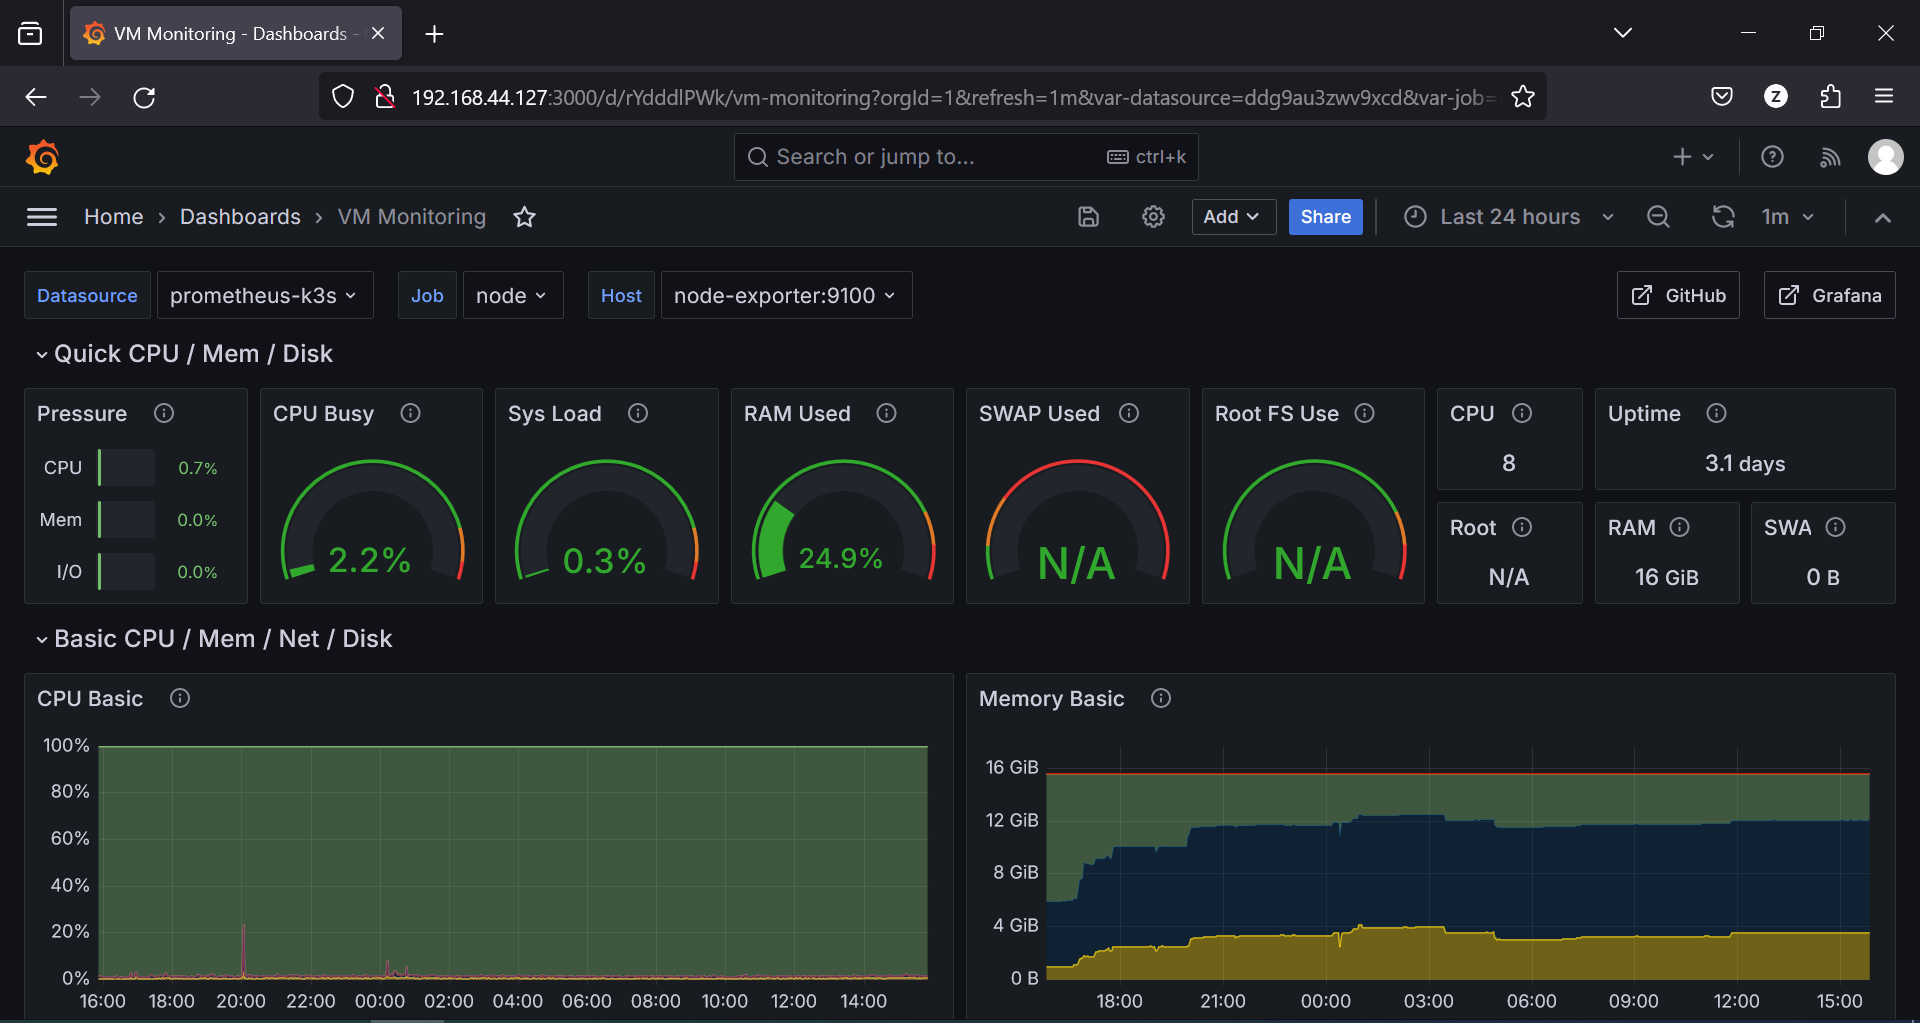
Finally, the dashboard will appear:
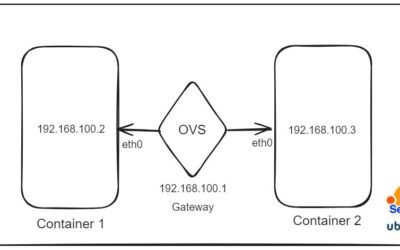
How can I add another server in monitoring?
The function of Node Exporter in Prometheus is to collect system-level metrics from the nodes in a cluster. These metrics include CPU usage, memory usage, disk I/O statistics, network activity, and more. Node Exporter is essentially a Prometheus exporter that runs on each node in a cluster and exposes these system-level metrics in a format that Prometheus can scrape.
To bring another server into monitoring with Prometheus, you will need to install Node Exporter on that server as well. After that you need to update Prometheus configuration. Edit your Prometheus configuration file (prometheus.yml or prometheus-configmap.yaml) to include the new server as a scrape target. Add a new scrape_configs section with the appropriate job_name and static_configs specifying the IP address or hostname of the server running Node Exporter and the port (9100). Ensure that Prometheus can reach the Node Exporter endpoint from the network. Finally, restart the Prometheus service to apply the changes.


0 Comments